Top 5 AG Grid Alternatives in 2026: Pricing, Numbers and Use Cases
June 3, 2025•6 min read

I hope you enjoy reading this post. If you want us to do your frontend development or design, click here.
Author: Alex Vasylenko | Founder of The Frontend Company
AG Grid is undoubtedly the most advanced JavaScript data grid on the market.
It's fast, has many enterprise features, and is built to handle everything from live trading dashboards to complex financial UIs.
That's why many of our enterprise clients choose AG Grid without hesitation. When performance, stability, and deep functionality are crucial — and the budget allows — it's often the safest choice.
But not every team needs all of it.
And not every company wants to pay $10,000+ per year to keep their tables performing well.
In recent years, I've seen more and more teams in SaaS, internal tooling, or B2B start to question whether AG Grid is the right fit. Not because it's lacking features but because many go unused, and the price, integration complexity, and developer experience can become hard to justify.
That's why I wrote this article:
A focused look at the top AG Grid alternatives in 2026 for teams that still need serious grids but don't want to overpay or over-engineer their frontend stack.
Each option here is capable, proven, and used in production by big companies. Some are leaner, some more customizable, some easier to integrate — and yes, some are free.
Let's break them down.
TanStack Table (formerly React Table)
TanStack Table is a headless UI library for building tables in React (and now other frameworks via core adapters). Headless means TanStack Table provides the table state management and logic, but no default UI – developers bring their own markup and styles. This is a fundamentally different approach from component-based grids like AG Grid.
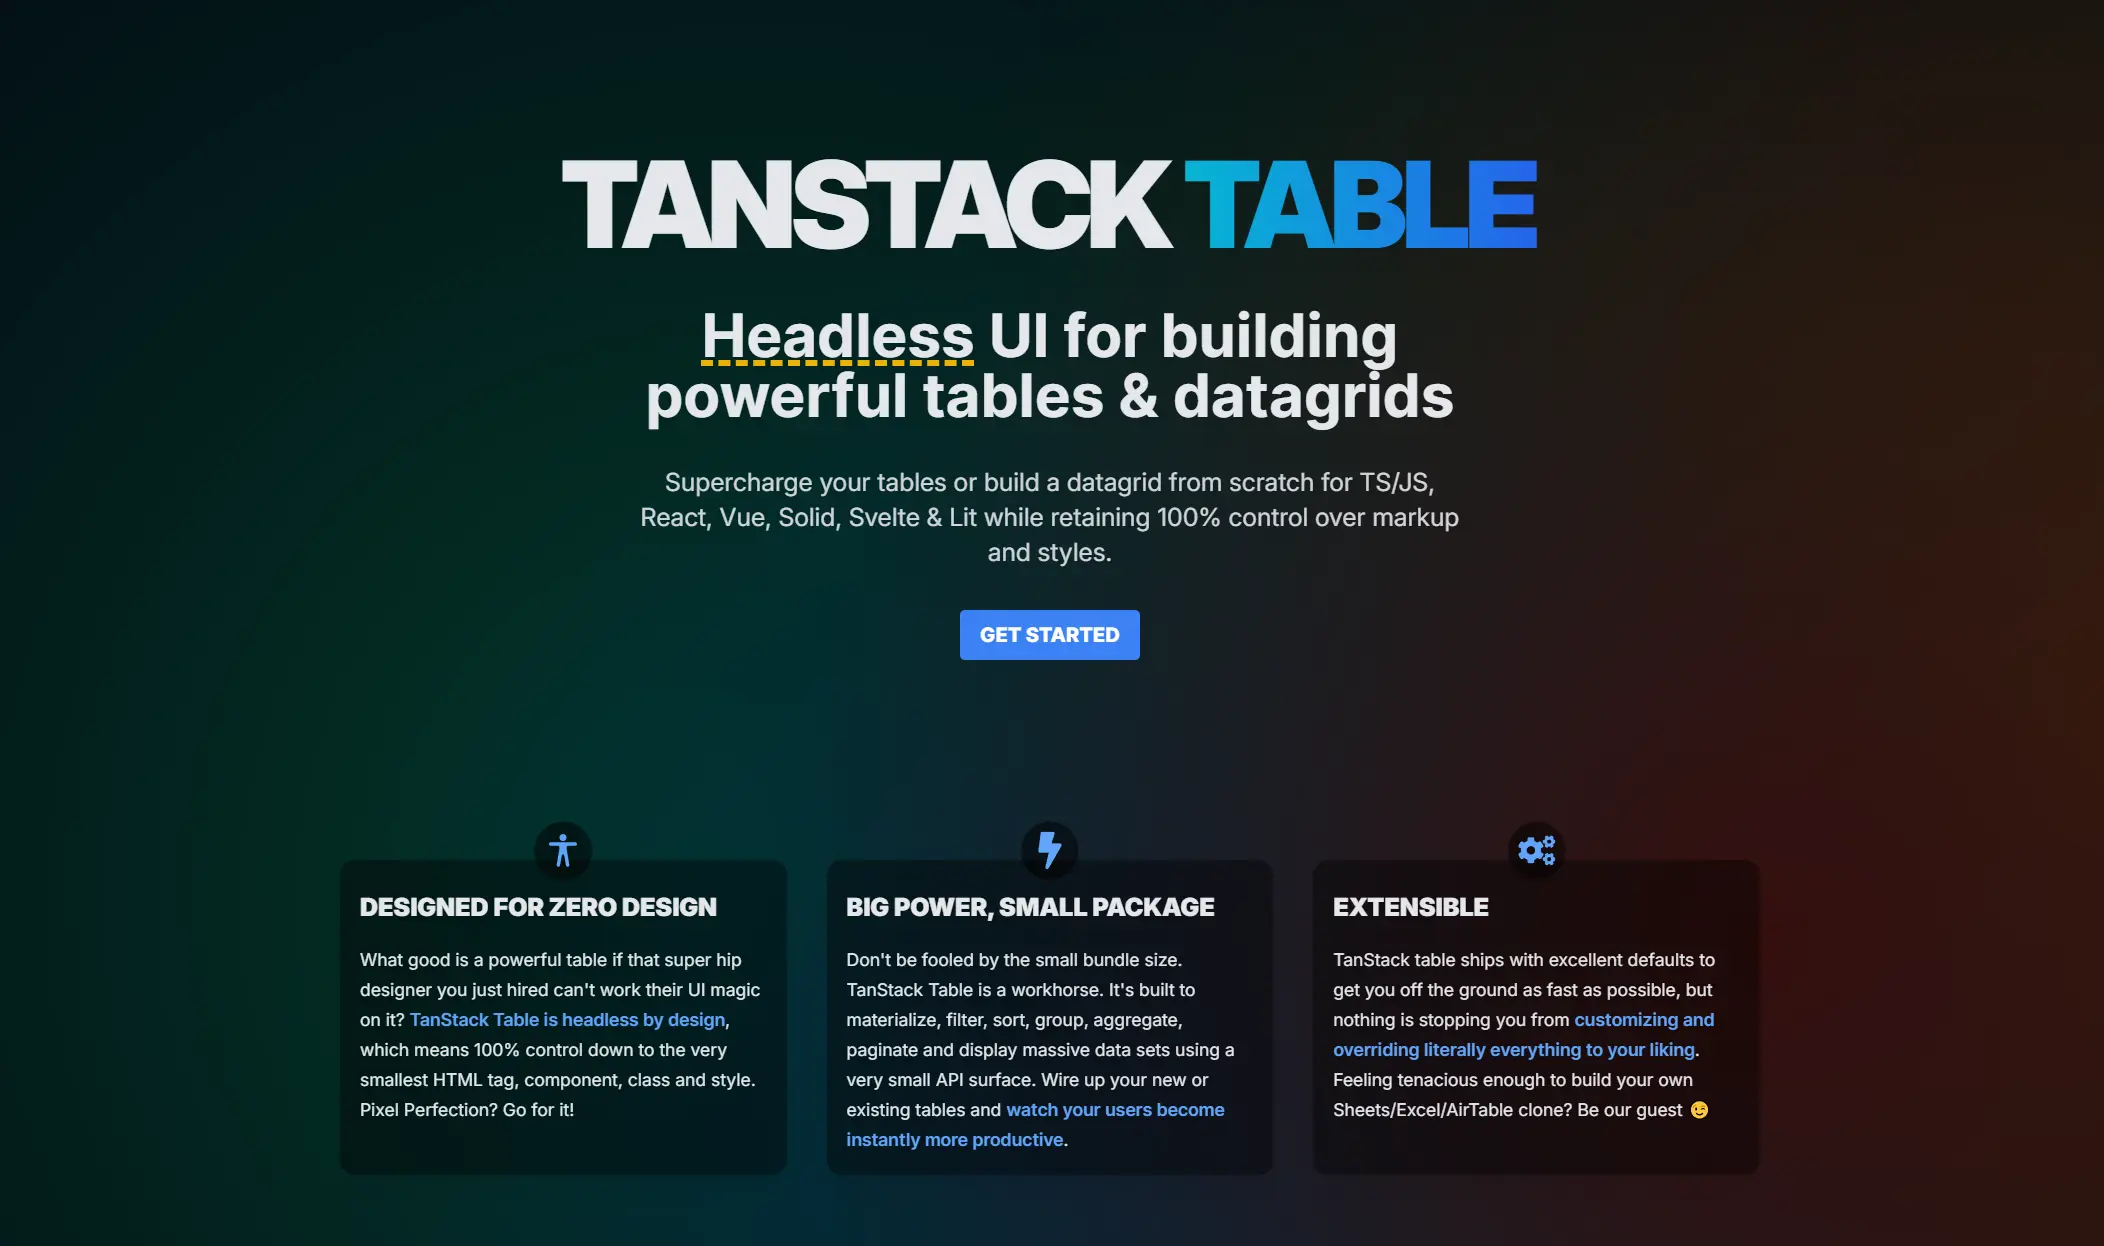
TanStack Table gives developers hooks or utilities to manage sorting, filtering, grouping, pagination, etc., and they render it how they want. It's written in TypeScript and offers first-class bindings for React, Solid, Svelte, Vue, Angular, Qwik, and plain TS/JS.
Notably, TanStack Table's author (Tanner Linsley) collaborates with the AG Grid team, positioning TanStack Table and AG Grid as complementary for different use cases.
NUMBERS:
⭐ 26.4k GitHub stars
📦 3.5M+ weekly downloads on NPM
🔁 Last release: April 2025
PRICING:
TanStack Table is 100% open-source (MIT license).
There is no paid/pro tier for the library itself – all features are free to use.
It's a great choice if your budget is tight, but you still need a robust solution. However, keep in mind that because it's headless, you might invest more developer time building UI around it, so the cost comes in implementation rather than license fees.
BEST USE CASES:
If you're making an admin dashboard and you want to use your own table rows, cells, and modals but need sorting and filtering logic, TanStack Table gives you that logic without imposing UI constraints. It's also great for cases where you only need a subset of features and want to keep things lean.
Many internal tools, SaaS dashboards, and B2B apps use TanStack Table for standard data tables that aren't as complex as a full spreadsheet but still need things like multi-sort, pagination, etc.
COMPARISON TO AG GRID:
Performance: In scenarios with very large data sets, AG Grid's highly optimized DOM handling might have an edge, but a TanStack Table + Virtual solution can also handle tens of thousands of rows smoothly.
Flexibility: TanStack Table wins hands-down on flexibility/customization because it requires devs to define the UI. They can achieve any layout or design since they are in charge.
Integration Complexity: Integrating TanStack Table into a React app is lightweight – import the hooks, define columns and options, and map UI to the state. But using it to build a full-featured grid can be more complex overall. Devs will assemble pieces like sorting UI, filter components, etc., whereas AG Grid will give those to them.
Support: AG Grid Enterprise comes with support. TanStack Table relies on the Community and the maintainer's goodwill.
It feels like Lego for tables — you get the pieces, but you build the castle. It's not AG Grid, but if you don't need Excel-in-the-browser, TanStack Table will get you 90% of the way faster and cheaper.

Transform your UI for peak performance!
🔹
Unlock seamless, high-performance frontend solutions tailored to your business.
🔹
Get an interface that outshines competitors and delights your users.
MUI Data Grid
MUI Data Grid is part of the MUI ecosystem — the most widely adopted React component library built on Google's Material Design. The free version provides essential features like sorting, filtering, pagination, selection, and editing. But more advanced features like grouping, Excel export, tree data, or virtualization require MUI X Pro or Premium.
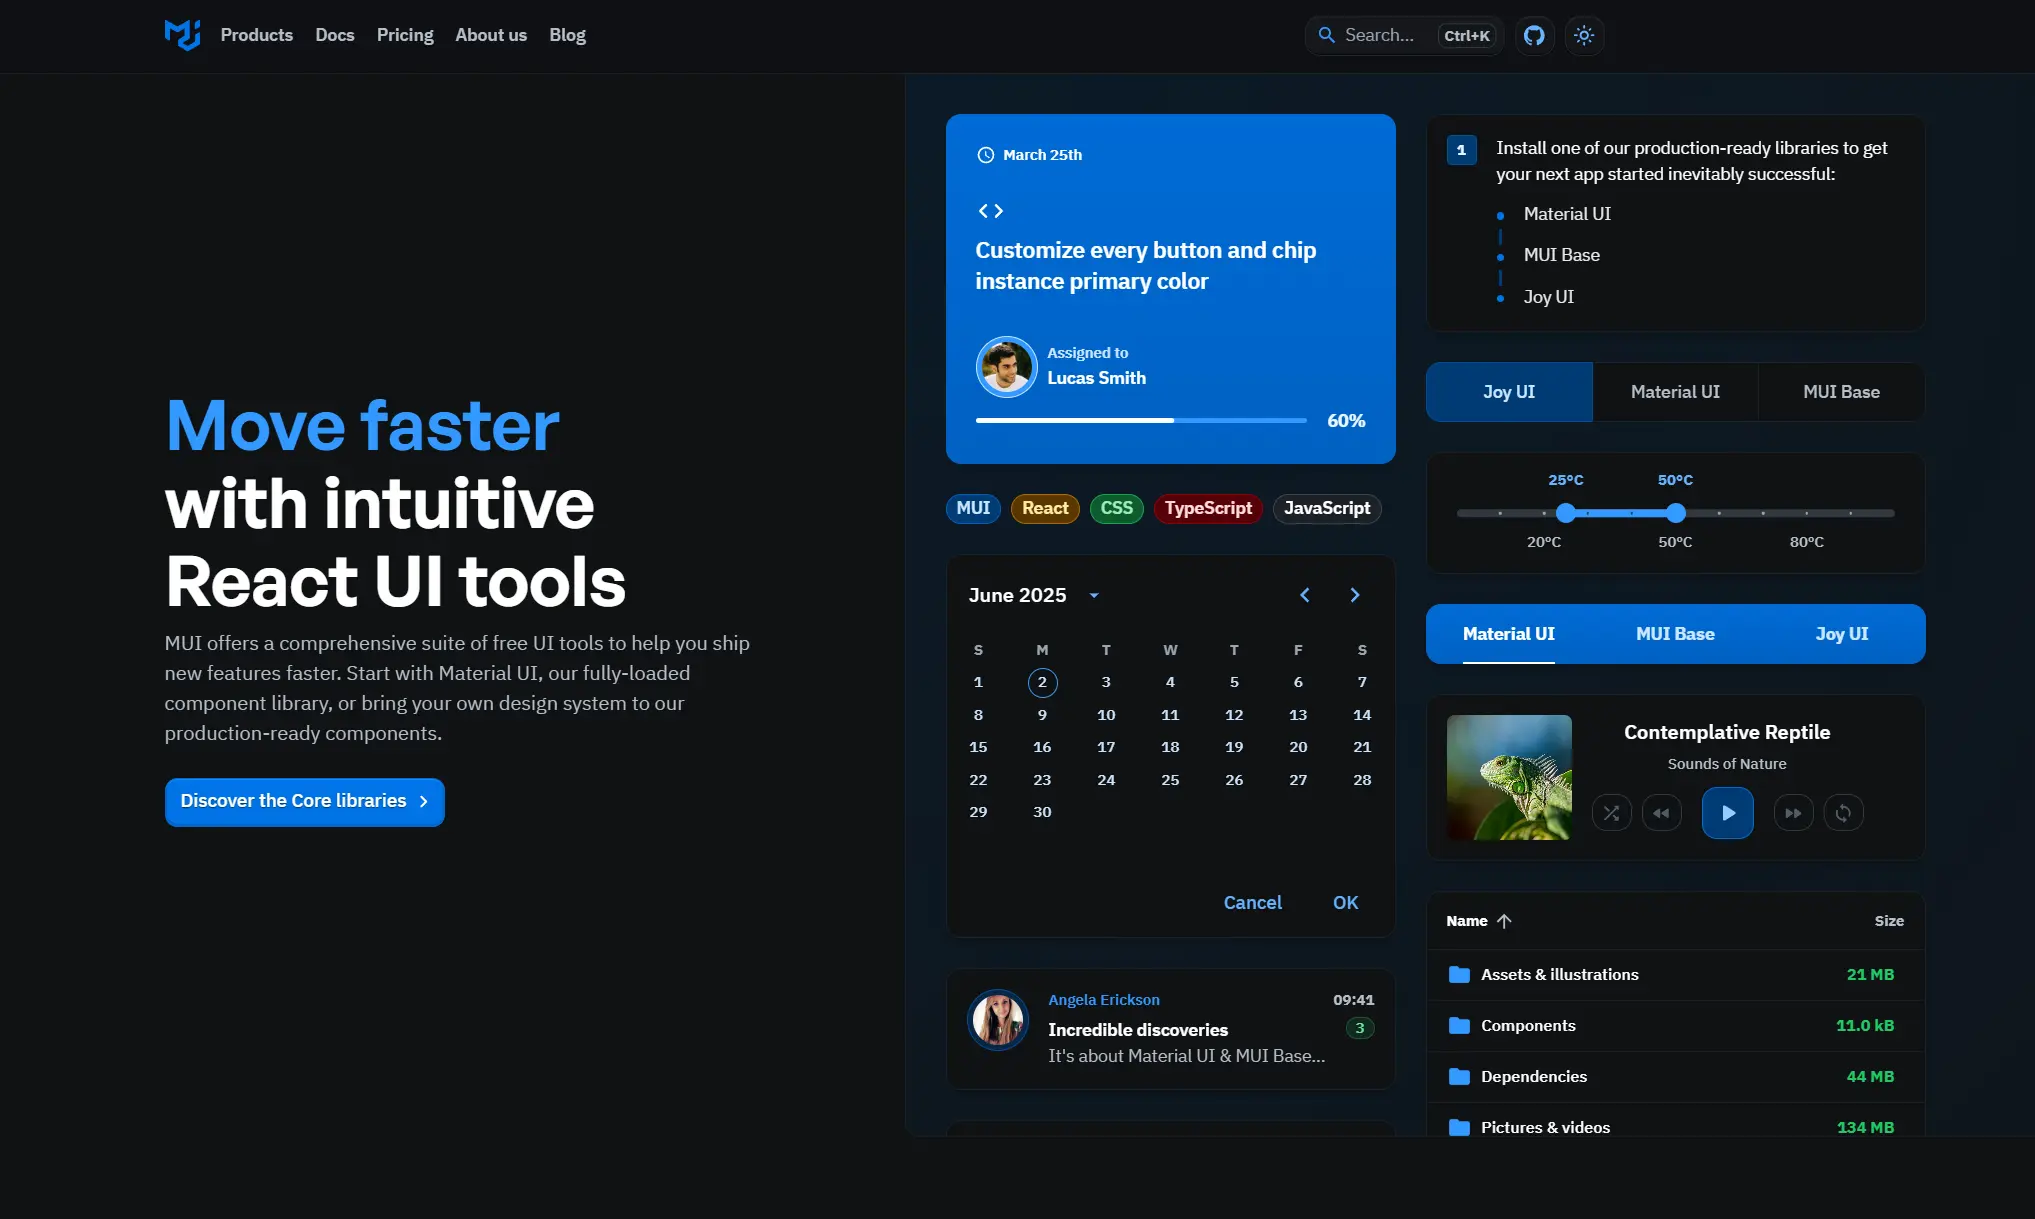
Unlike headless libraries like TanStack Table, MUI Data Grid comes with a ready-to-use UI that matches the Material Design system — making it a good fit for teams already using MUI across their app.
Performance is solid for most use cases, and it's actively maintained by the core MUI team.
NUMBERS:
⭐ 4.9k+ GitHub stars
📦 1,6M+ weekly downloads on NPM
🔁 Last release: May 2025
PRICING:
Free tier: @mui/x-data-grid (MIT license)
Pro & Premium: Commercial licenses
Pro: Starts at $180/per developer/year
Premium: $588/per developer/year, including pivoting, Excel export, advanced grouping, and more
MUI Pro/Premium offers a one-time annual license model, unlike AG Grid's per-developer license. Still, for growing teams or multiple deployments, costs can creep close to AG Grid levels. The licensing model requires all developers on a project using Pro/Premium to be licensed.
BEST USE CASES:
If your team is already using Material UI, this grid is an obvious fit — you get consistent design out of the box with no styling work. Great for admin panels, back-office tools, internal dashboards, or B2B SaaS apps where you're building fast and don't need exotic grid features.
It's also ideal when you want basic to mid-level grid functionality with minimal configuration. Built-in components, pagination, and filtering are quick to wire up.
COMPARISON TO AG GRID:
Feature set: AG Grid Enterprise still outguns MUI Premium in a few areas. For example, AG Grid has an integrated pivot UI that's arguably more sophisticated, and things like integrated charts on aggregated data. However, MUI covers 80-90% of typical needs quite well.
Performance: MUI Grid performs well for standard-sized datasets but doesn't match AG Grid when pushing virtualized performance with tens of thousands of rows or deep custom logic.
Flexibility: More flexible than you'd expect — especially with the Pro version — but you're still working within the constraints of Material Design components. AG Grid allows more fine-grained control over behavior and appearance, but MUI wins on developer speed and consistency.
Integration Complexity: Very smooth if you already use MUI. Hooks-based API and prebuilt components make it fast to integrate. It has much less overhead than AG Grid but also has fewer capabilities.
Support: Pro and Premium tiers include enterprise support. The free version is community-supported, with good docs but limited issue response unless you're a paying customer.
MUI Grid feels like the pragmatic middle ground — not as deep as AG Grid, not as DIY as TanStack Table. If you already live in MUI land, it's the fastest path to a decent table UI without writing custom renderers or buying a Ferrari.
Handsontable
Handsontable is a specialized data grid library built to deliver a true Excel-like experience in the browser. It's written in vanilla JavaScript, with official wrappers for React, Angular, and Vue — but under the hood, it's framework-agnostic.
What sets Handsontable apart is its focus on spreadsheets, finance-heavy UIs, and editable data grids. It supports complex features like formulas, dropdowns, cell validation, and copy-paste that work just like Excel. The grid is styled minimally by default, but the real power is in its behavior, not its appearance.
NUMBERS:
⭐ 21k GitHub stars
📦 144K+ weekly downloads on NPM
🔁 Last release: March 2025
PRICING:
Free tier: Free to use for non-commercial purposes (like evaluations, personal projects, research, open-source projects) under a custom "non-commercial and evaluation" license
Commercial license only, based on usage
Starts around $3,000/year for small teams
Enterprise plans to scale with usage/users
There's a 30-day trial, but long-term use requires a license. Unlike AG Grid, there's no free community version — everything is part of the paid product.
BEST USE CASES:
Handsontable absolutely shines in situations where end-users need to input or manipulate a lot of data in a tabular form and expect a spreadsheet-like experience.
Some classic examples:
Financial applications (e.g., budgeting tools where users enter numbers and formulas).
Accounting or auditing software (where you have tables of entries that need validation and formula-based totals).
ERP systems (like a production planning sheet or inventory management where managers edit tables of data).
Scientific or engineering apps (maybe a grid to enter experimental data with validations and immediate formulas).
COMPARISON TO AG GRID:
Feature focus: AG Grid (especially Community) is more about viewing and basic editing of large data efficiently, plus things like grouping/pivot in Enterprise. Handsontable is about intensive editing and formula computation on data.
Performance: Both are fast, but AG Grid is stronger at rendering huge virtualized datasets. Handsontable focuses more on interactive editing performance than raw display speed.
Flexibility: AG Grid is more flexible overall — especially for custom renderers, async data, or UI integration. Handsontable is focused and opinionated, but that's a strength when you need Excel-like behavior without DIY.
Integration Complexity: AG Grid requires more setup but is also more adaptable. Handsontable's API is relatively simple, but customizing behavior outside spreadsheet-like patterns can get tricky.
Support: Handsontable includes enterprise-grade support with all licenses — plus stable long-term versions, detailed docs, and enterprise SLAs. That puts it closer to AG Grid than most open-source competitors.
If AG Grid is a Swiss Army knife, Handsontable is a surgical scalpel — hyper-focused on editable, spreadsheet-style grids. It's not the most flexible, but if your app is a spreadsheet, nothing beats it.
DataTables
DataTables is a classic JavaScript data grid library originally built as a jQuery plugin — but as of version 2.x, it now works without jQuery and offers official wrappers for React and Vue 3. It's a full-featured grid for traditional tabular displays, offering sorting, filtering, pagination, fixed headers, server-side rendering, and dozens of plugin extensions.
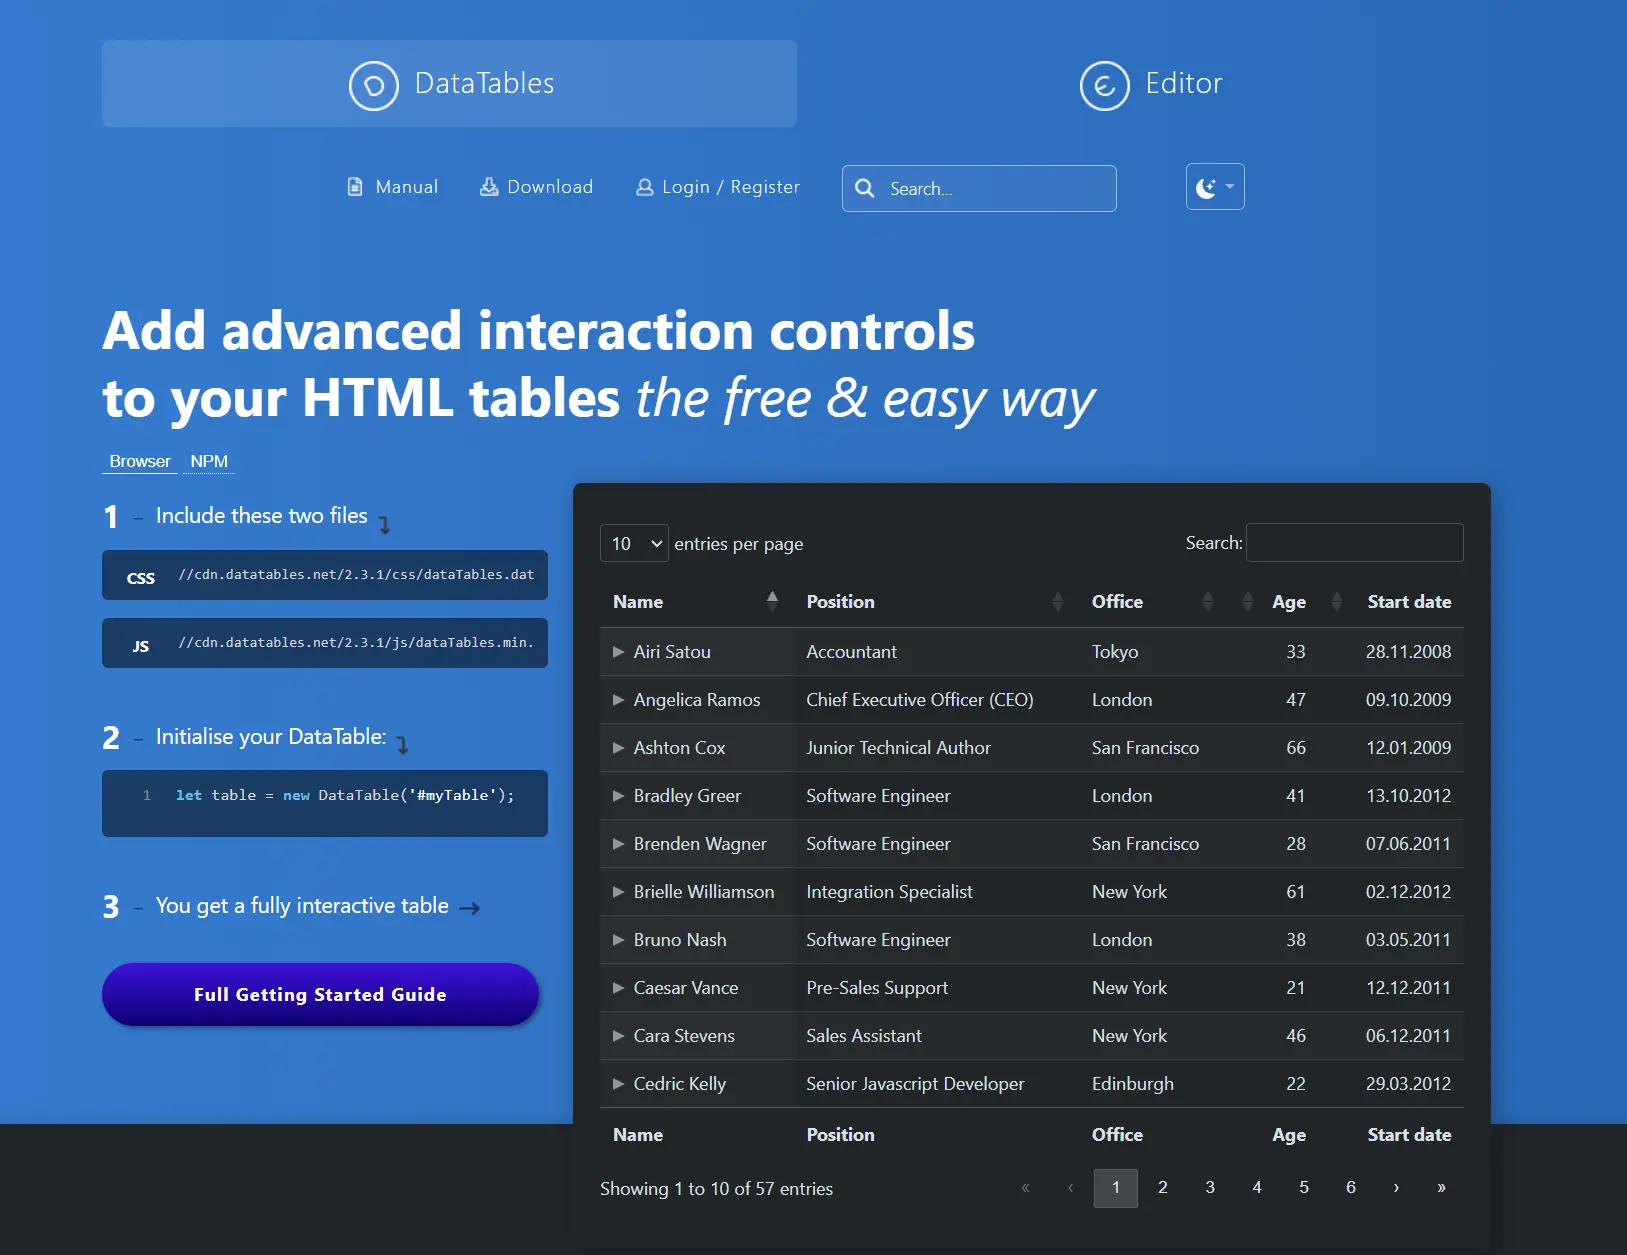
What sets DataTables apart is its longevity and reliability. It's used by thousands of enterprise and public sector projects where server-rendered tables are typical.
NUMBERS:
⭐ 7.4k GitHub stars
📦 43+ weekly downloads on NPM
🔁 Last release: May 2025 (v2.3.1)
PRICING:
Free tier: MIT license, includes core features and many extensions like Responsive and Scroller
Paid tier:
A single license starts at $119. Then $48/year
5-dev pack: $549, then $220/year
10-dev pack: $929, then $372/year
Support plans are also available, starting at ~$499/year
There's no per-project or per-domain fee — one license gives you unlimited usage. Compared to AG Grid Enterprise, DataTables is dramatically cheaper, especially for small teams who need editing.
BEST USE CASES:
DataTables still shines in scenarios where you need a quick, robust HTML table enhancement without adopting an entirely new framework-specific grid. For example, content-heavy dashboards, admin interfaces, or legacy jQuery/PHP projects can benefit from DataTables' rich feature set (sorting, filtering, etc.) with minimal setup.
DataTables makes the most sense when you are already using jQuery and don't mind a DOM-centric approach or specifically want its features and are willing to integrate it via the provided wrappers. If your team is starting a brand-new React project and needs a grid, you might instead consider a native React grid unless DataTables offers something unique you need.
COMPARISON TO AG GRID:
Feature Set & Customization: Both libraries are feature-rich, but they emphasize different things. DataTables provides a broad set of plugins (filter panels, row grouping, fixed headers, etc.) that cover most standard needs. AG Grid, especially in its Enterprise edition, offers advanced grid features like column drag/drop, grouping, pivot tables, tree data, integrated charts, and custom cell renderers that can even be React/Angular components.
Performance: Both handle medium data volumes well. AG Grid is superior when rendering large, client-side datasets with virtualization. DataTables performs better when doing server-side processing, which it's designed for.
Flexibility: AG Grid wins on deep customization (React components in cells, custom editors, pivoting, etc.). DataTables is more structured and plugin-driven — you follow its model rather than extend it deeply.
Integration Complexity: AG Grid offers a true component experience in React, Angular, and Vue. DataTables is adapted for modern frameworks, but it still manages DOM manually — not ideal for reactive patterns. You'll use API calls (table.row.add()) instead of declarative props.
Support: AG Grid Enterprise offers formal SLAs and team-wide support. DataTables provides optional support, and while it's actively maintained, it's largely a solo effort. Docs and community support are solid, but it's not the same enterprise-grade promise.
DataTables is the veteran — not flashy, but battle-tested. If your tables are structured, your data comes from the server, and your team doesn't need pivoting or tree data, it still delivers.
Tabulator
The last alternative to AG Grid on my list is Tabulator. It is a powerful, lightweight data grid library written in vanilla JavaScript with first-class support for React, Vue 3, Angular, and plain JS/TS. While it doesn't offer a headless architecture like TanStack Table, it gives developers full control over UI and behavior with a highly customizable rendering engine.
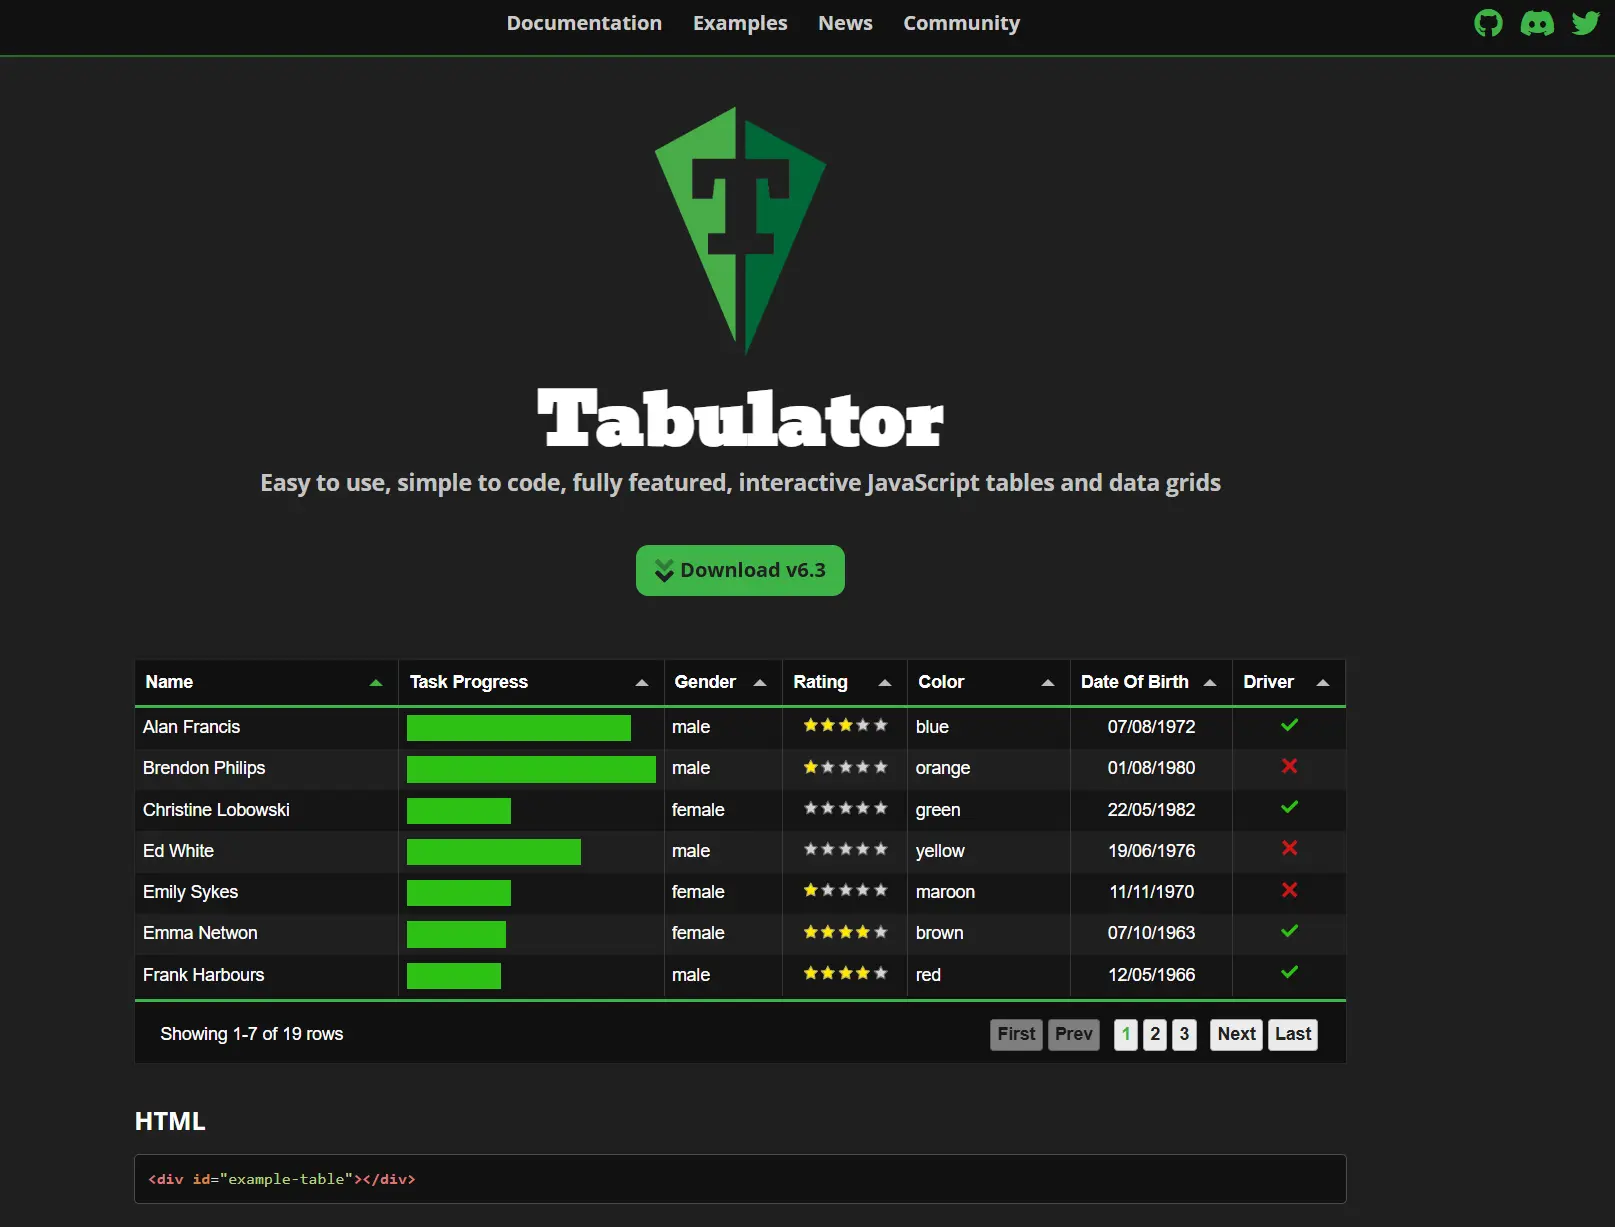
Tabulator supports key features like virtual scrolling, grouping, pagination, tree data, inline editing, responsive layouts, and export formats (CSV, JSON, XLSX, PDF).
NUMBERS:
⭐ 7.1k GitHub stars
📦 72K+ weekly downloads on NPM
🔁 Last release: March 2025 (v6.4)
PRICING:
100% open source under the MIT license
No paid tiers or commercial version
Optional Patreon and GitHub sponsorship for support
BEST USE CASES:
Tabulator is ideal for:
Internal tools and dashboards that need rich data display with custom interactivity
Projects where teams want a robust grid without paying enterprise fees
Apps that need exports, inline editing, and responsive behavior — but don't need AG Grid's advanced pivoting or server-side engine
Developers who want a balance between structure and customization without writing a grid from scratch
It's a great choice when you need most features AG Grid offers, but want a simpler, open-source experience.
COMPARISON TO AG GRID:
Performance: Tabulator performs well with medium to large data sets — supports virtual DOM, lazy rendering, and dynamic data loading. AG Grid has the edge at extreme scale or complex real-time updates, but Tabulator handles thousands of rows without a problem.
Flexibility: Both are very customizable, but Tabulator is simpler to extend out of the box — with clear config objects, built-in formatters, and minimal boilerplate. AG Grid offers more enterprise-grade features but often requires deeper integration work.
Integration Complexity: Tabulator is easy to drop into any stack, and the React/Vue wrappers feel natural. AG Grid's learning curve is steeper but offers a more advanced configuration. Tabulator is more approachable for smaller teams or solo devs.
Support: AG Grid Enterprise comes with SLAs, while Tabulator relies on its community and the project maintainer. Docs are solid, and the GitHub repo is active, but there's no formal support model.
Tabulator is like the indie rock band of data grids — sharp, versatile, and plays loud without a label. If you want AG Grid-level power with a friendlier API and zero licensing drama, this one's hard to beat.
AG Grid Alternatives Table
Grid | Pricing | GitHub Stars | Best For |
|---|---|---|---|
TanStack Table | Free | 26.4k | Custom UIs, headless logic, React-heavy stacks |
MUI Data Grid | $180–$588 per dev/year | 4.9k | Apps using MUI, fast admin tools |
Handsontable | $3,000+ per year | 21k | Excel-like UIs, finance, and data-heavy editing |
DataTables | $119+ one-time, $48+/year | 7.4k | Server-rendered tables, legacy or stable apps |
Tabulator | Free | 7.1k | Open-source grids with full features, no cost |
When Should You Look for AG Grid Alternatives?
AG Grid is powerful — but not every team needs a Formula 1 car to drive to the grocery store.
Here are some signs you need to explore AG Grind Alternatives:
You're only using 10% of its features. If you're not pivoting, grouping, or virtualizing 100k rows, you may be overpaying in license fees and developer time.
You're building fast-moving internal tools. For admin panels or CRUD dashboards, leaner grids (like TanStack Table or Tabulator) can ship faster and be easier to maintain.
Your design system is fighting AG Grid's styling. If you're spending more time overriding AG Grid's look than building features, consider something more UI-agnostic.
You're working with a tight budget. If you're a small team or an early-stage product, $10K+/year for a grid is too much. Alternatives offer 70–90% of AG Grid's value at 0–30% of the cost.
You want React-first development. AG Grid works with React, but doesn't feel native. If you prefer hooks, component-based logic, and minimal wrappers, TanStack Table or MUI may be a better fit.
Need to Confirm Your Choice?
If anything in this guide resonates with your current challenges, don't guess.
Book a 1-hour call with The Frontend Company. We'll help you:
Confirm if AG Grid is overkill or still the right long-term bet
Match your stack and use case to the right grid
Outline the first steps of implementation so you don't burn a sprint rewriting tables
Choosing the right data grid is a strategic decision. We've helped teams replace AG Grid — and helped others double down on it — depending on the reality of their apps, users, and team structure.
Let's make sure you're investing in the right direction.
Unlock the full potential of your product

Boost customer retention & satisfaction
Become more competitive on the market
Move to the latest technologies stacks
Improve usability & visual appeal
FAQ


Alex Vasylenko is the founder of The Frontend Company, DBC and several other successful startups. A dynamic tech entrepreneur, he began his career as a frontend developer at Deloitte and Scandinavia's largest banking company. In 2023, Alex was honored as one of 'Top 10 Emerging Entrepreneurs' by USA Today.
RATE
Rate this article please
This will help us provide more useful information.
821 ratings, average 4.95 out of 5